This Links piece is free for all, since, as I mentioned earlier, I’m going on a brief hiatus, taking a Midwest journey for the next two weeks. Posting will resume either on the 20th or 25 of October.
Today’s pieces share a theme. I offer climate charts from two excellent Twitters, Zach Labe and Leon Simons. Both have good ability to make the technical make sense. I hope you benefit from this presentation and consider following them.
Zack Labe
Twitter: https://twitter.com/ZLabe
Bluesky: https://bsky.app/profile/zlabe.bsky.social
Climate Scientist (Atmospheric) PhD | Postdoc at @Princeton and @NOAA_GFDL | Sharing data-driven stories | He/Him | Views my own
Leon Simons
Twitter: https://twitter.com/LeonSimons8
Mission: To understand & protect the home planet. Innovator, climate researcher, social entrepreneur. Board member, Club of Rome, NL
Links
Seven graphical links for your climate consideration.
• Sea surface temperatures for the North Atlantic (Zack Labe)
The magnitude of the 2023 increase should surprise you. It does me. This observation was anticipated by James Hansen, discussed here. Note that the real El Niño increase has yet to appear; that comes in the year following the actual El Niño event.
• Loss of global sea ice (Zack Labe)
The zero line is midway up the chart. Above zero is gain. Below zero is loss.
Again, it’s the magnitude that’s surprising. More evidence of acceleration.
• Temperature change over land, 1924–2023 (Zack Labe)
This one is a GIF, so you’ll have to click the link (above or in the graphic) to watch it. The surprise comes at the end.
• Annual maximum Antarctic sea ice — 1979–2023 (Zack Labe)
This shows the annual maximum extent of sea ice at the South Pole. This one is also animated, if you want to click through. Maximum sea ice is markedly less.
There’s theme here, yes?
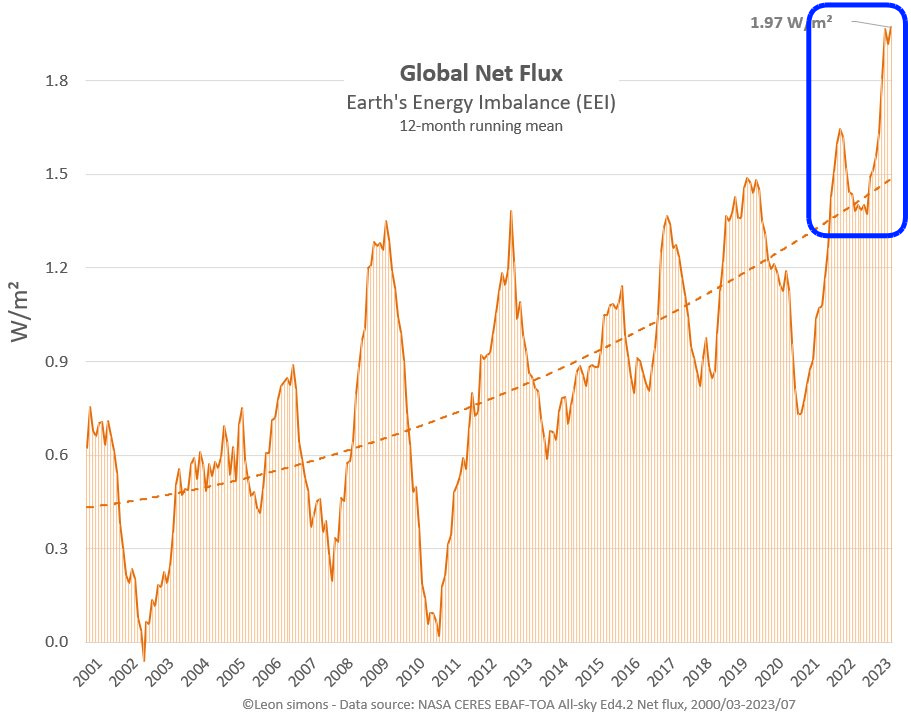
• Earth Energy Imbalance (EEI) is accelerating (Leon Simons)
Earth Energy Imbalance is energy-in minus energy-out over the entire planet. Energy-in is the sun. Energy-out is radiation back into space. What doesn’t get radiated back, stays.
A bigger number is bad since it causes of our warming. The action is at the end of the graph.
We discussed Earth Energy Imbalance here.
• Comparing three strong El Niño years (Leon Simons)
Next year, the post-El Niño year, will be a doozy. (Post-El Niño years aren’t shown above.)
• Cumulative daily wildfire carbon emissions in Canada, by year (Axios via Leon Simons)
Is it a problem yet? Or does football have to be canceled for people to notice?
Just kidding. The answer to the last question is yes, since none of this has made it onto the “news” that most people watch. Our masters, in their wisdom, don’t wish to worry us.
File under “As long as the rich stay rich, the rest is all good.”
Music
And after that cheery note, these cheerier notes — your weekly music treat. This time, something a little out of the ordinary.
If you enjoy classical music, I you’ll love this video. And if you’re not a big fan, give it a listen anyway. The quick patches of music are delightful, the playing superb, and his explanation of what each pianist is doing — fingers, arms, body — makes you really appreciate what you’re hearing. Enjoy!


